This brief post shows you how to make your own power curve plots using ggplot2. The bulk of this post is the code and many comments that explain each step. purrr::map, broom::tidy and dplyr::bind_rows are the main functions that prepare the data for the plot. The actual plotting of the power curves is very simple. The example here uses the package pwr instead of the base R power functions, but the code to use the base functions would be nearly the same.
library(tidyverse)
library(broom)
library(pwr)

# start with a vector of effect size values to plot
seq(.2, 1, .2) %>%
  # reverse the vector so the legend labels
  # and the curves are in the same vertical order
  rev() %>%
  # map will help us perform power calculations for every
  # value in the vector of effect sizes
  map(
    # the purrr function will first do the power calculations,
    # then turn it into a data frame,
    # then make a column that records the effect size
    ~ pwr.t.test(
      # small steps in n values make a smooth plot
      n = seq(2, 100, .05),
      # .x is each value in the effect size vector
      d = .x) %>%
      # turn the power.htest object into a dataframe (tibble)
      tidy() %>%
      # keep track of the effect size
      # for this set of calculations
      mutate(effect_size=as.factor(.x))
  ) %>%
  # map will return a list of data frames of the power
  # calculations so we need to turn it into a single dataframe
  bind_rows() %>%
  # now we have data we can plot as usual!
  ggplot(aes(n, power, color=effect_size)) +
  # we used a lot of points so this geom_line will look smooth
  geom_line() +
  labs(y="Power",
       x = "Sample size",
       color = "Effect Size") +
  theme_bw()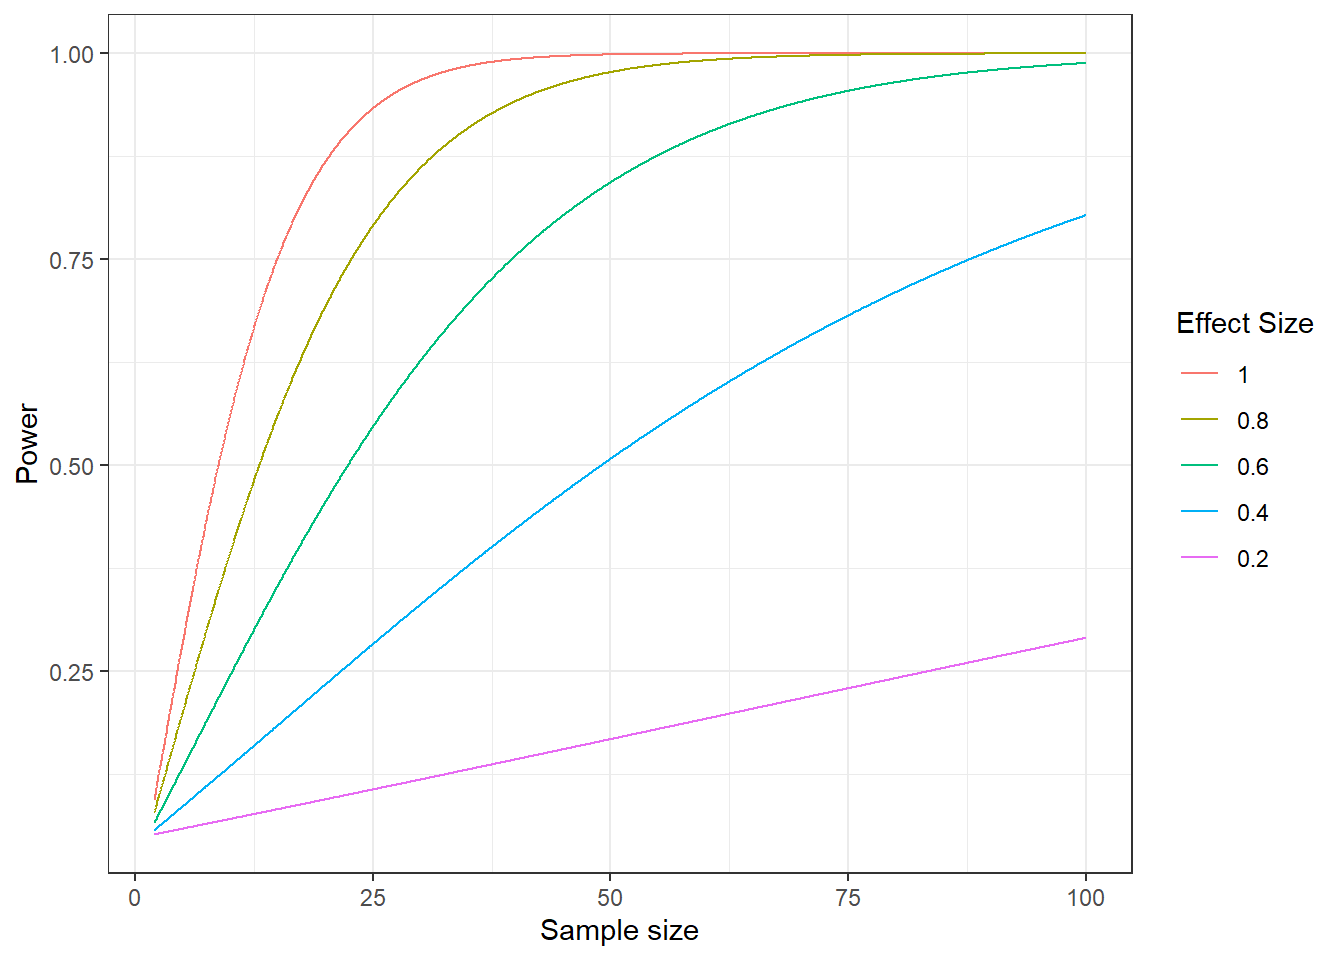
If you want to see the code without all the comments you can see it here.
seq(.2, 1, .2) %>%
  rev() %>%
  map(~ pwr.t.test(n = seq(2, 100, .05),
                   d = .x) %>%
        tidy() %>%
        mutate(effect_size=as.factor(.x))
  ) %>%
  bind_rows() %>%
  ggplot(aes(n, power, color=effect_size)) +
  geom_line() +
  labs(y="Power",
       x = "Sample size (for each condition)",
       color = "Effect Size") +
  theme_bw()